
Efficient sales processes are key for any successful business. Predictive forecasting, now available in Microsoft Dynamics 365 Sales Insights, enables proactive decision making for any aspect of the sales process.
While it’s impossible for humans to know and predict the future, advanced machine learning technologies for sales can help you forecast sales more accurately. Dynamics 365 does this by extracting patterns from your customer relationship management (CRM) data (current and historical engagements) and then projecting these patterns into the future.
In the past, forecasting systems used to be complicated, requiring significant investments from an organization in technology, data availability, and data scientists. The good news is that Dynamics 365 Sales Insights is now doing this process for you. Dynamics 365 Sales Insights allows you to leverage our 360-degree view of your business data and create a predictive forecast solution out of the box!
Predictive sales forecasting for hierarchical data
Forecasting is the projection of what a salesperson, team, or organization will sell in a defined period. Forecasting can be manual, based on a salesperson’s belief keyed into the customer relationship management system. Manual forecasting is supported in Dynamics 365 Sales. In addition, with Dynamics 365 Sales Insights, we now offer predictive forecasting as seen in Figure 1 for user experience, which uses the wealth of data you already have in Dynamics 365, to overcome human biases and save manual work.
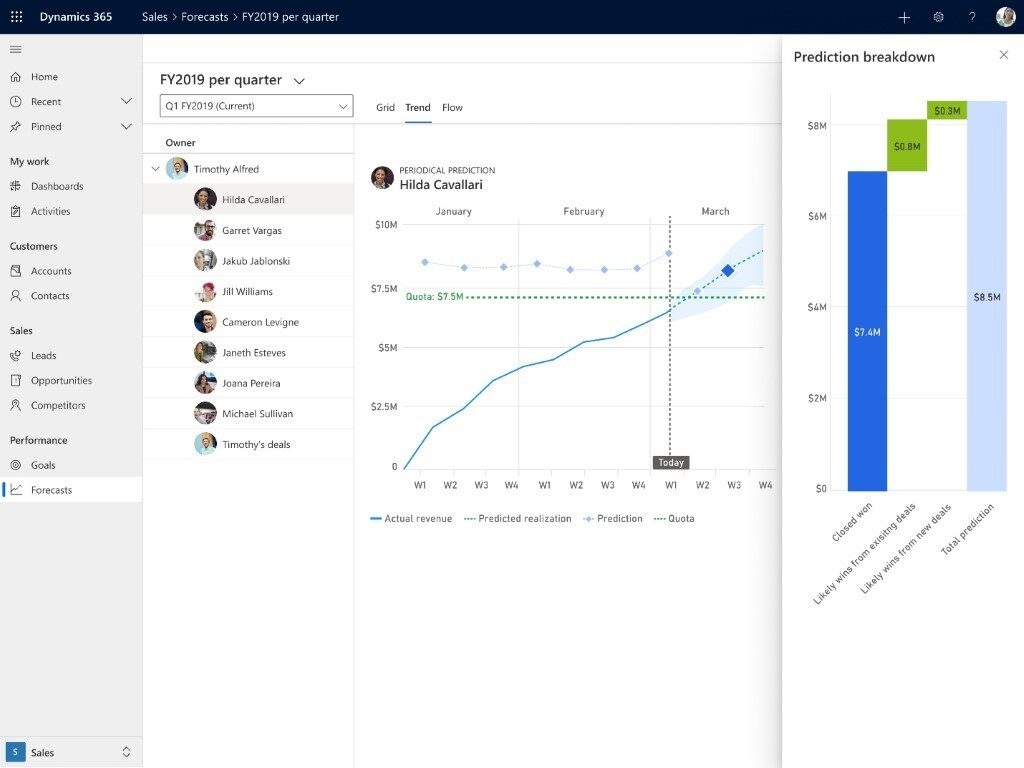
The table contains forecast values for all hierarchy members. Clicking on particular forecast value shows breakdown pane which forecast components values – closed wons, predicted wins from existing deals and predicted wins from future deals.
In order to support both strategic and tactical decisions, our customers have been asking for forecasts at various levels of the operational hierarchy such as the organizational, product, or territorial hierarchies as seen in Figure 2. This enables answering questions like “How much will we be selling in Australia next quarter?” or “Will my line of business meet the quarterly quota?”
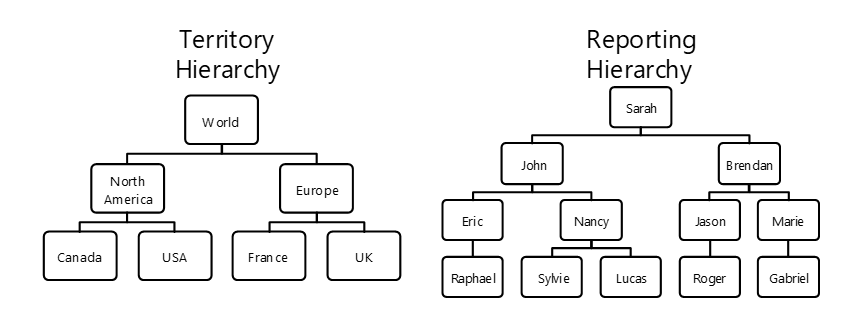
The schema shows examples for two kinds of hierarchies. One is by territory – for example World, North America, USA and Canada. And the other is Reporting Hierarchy – for example Eric reports to John and John reports to Sarah.
From time series prediction to a modular prediction approach
Predictive forecasting is traditionally seen as a time series prediction problem. That is, a series of past values is given, and future values of the series are being predicted based on patterns like seasonality, holidays, and trends. The underlying assumption is that historical values contain enough information to sufficiently predict the future values. This assumption holds for various domains.
Unfortunately, relatively long sales processes that are managed in customer relationship management (CRM) systems by sellers are found to generate noise in the data, and that data is often sparsely populated. Our experiments show that relying solely on historical sales is not enough to accurately forecast sales. This is particularly true when going downward in a hierarchy, using fine time granularity, or for small and mid-size businesses (SMBs). We simply need more data.
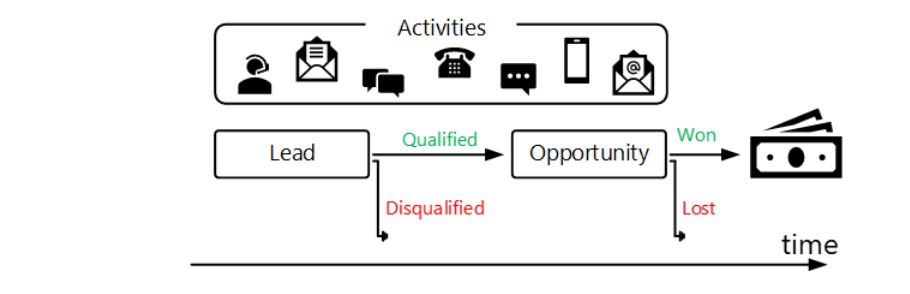
The good news is that Dynamics 365 stores a lot of relevant data from every phase of the sales cycle. The system manages all leads, opportunities, contacts, and accounts and activities from email, calls, and meetings involved in the sales process as seen in Figure 3. Tracking changes for each individual opportunity and lead, connecting it with activities and information like entities, intents, sentiment etc. extracted from them gives a broad view of the sales process and increases forecast accuracy, especially for the short-medium term.
The figure shows sales the entities involved in the sales process – starting from Lead which converts into Opportunity that can be Won or Lost. The process is accompanied with different types of activities like calls, emails, chats etc.
Modular forecast
Every forecast created in Dynamics 365 Sales starts from creating a forecast configuration. The main attributes of the configuration are time related, such as T start, which is the start date of the forecast, T horizon, or the forecast end and forecast period, or the time granularity. An additional input is the hierarchy for which prediction is required. Starting from T start until T horizon, the forecast is (re)calculated periodically, in order to include new evidence that flows into the system. We call the time of prediction T now.
From a forecasting point of view, revenue can be associated to closed opportunities, open opportunities, and unborn opportunities. Figure 4 below illustrates these three cases.
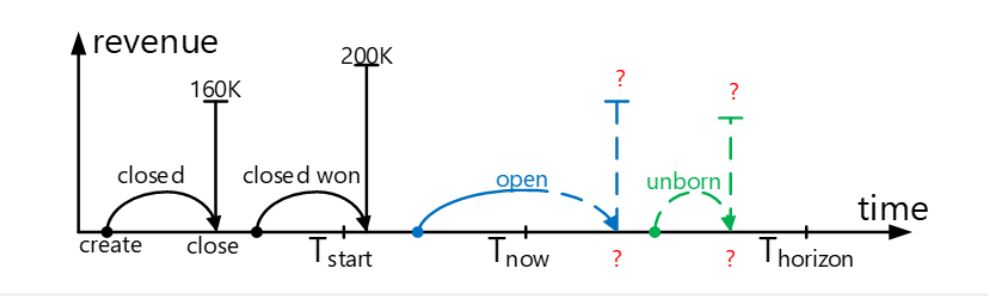
The figure shows opportunities from forecast point of view. All opportunities are projected on time and revenue axis system. For closed opportunities we know the close date and revenue, for open we know that they exists but close date and revenue are unknown. Unborn opportunities are yet to be created and we should predict future revenue that would come from them.
Closed won: Revenue already generated from opportunities closed between T start and T now. Nothing special here.
Pipeline revenue prediction: Revenue that would potentially be generated from opportunities that are currently open.
Unborn revenue prediction: Revenue that would be potentially generated from opportunities not yet existing in the system that are expected be won before T horizon.
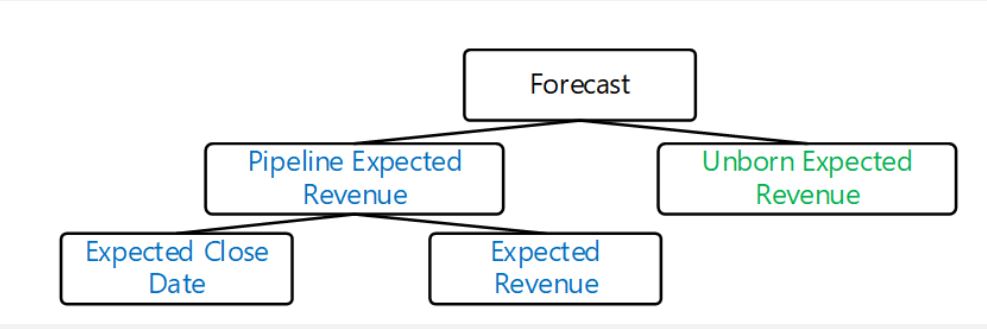
The figure shows modular forecast components hierarchy. Total forecast is a combination of expected revenue from pipeline. Pipeline revenue is predicted by predicting expected close date and expected revenue for all open opportunities. Another forecast component is revenue expected from the unborn opportunities.
Pipeline revenue prediction
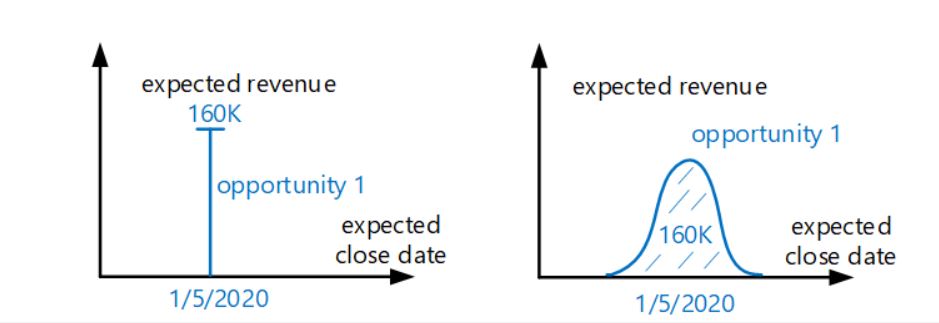
In order to forecast the revenue expected from open opportunities, we predict the expected close date and expected amount for each opportunity. If the expected close date falls before T horizon, the revenue is added to the forecast. The expected close date is estimated either as a point or as a distribution as seen in Figure 6, using various machine learning models. The models are tested on your business’s past data, to determine which models match your organization’s behavior best. Some examples of these models are decision trees ensemble-based regressors, deep neural networks, and probabilistic models.
Unborn revenue prediction
Unborn revenue is generated from opportunities not yet existing in the system that are predicted to be created and won between T now and T horizon. The revenue expected from these opportunities is estimated by statistical models based on observed value generation rate factored by time left until T horizon.
Forecast strategy selection
Each forecast component makes use of one of multiple algorithms. A predictive forecast strategy is a combination of one algorithm per component. Using historical data, we train each individual component and choose the strategy as the optimal combination. The motivation to optimal strategy selection comes from observing that different algorithms perform best for different customers, consistently.
Hierarchy
Various methods are available for creation of hierarchical forecasts. Forecasts at different levels are required to roll up the hierarchy in a consistent manner, being either Top-Down or Bottom-Up.
In Top-Down, the forecast is generated for the hierarchy root, and is then dis-aggregated downwards, based on historical ratios. The drawback is loss of information for the lower hierarchy levels.
In Bottom-Up, a forecast is generated for each hierarchy leaf, and higher-level forecasts are aggregations over the hierarchy levels. Bottom-Up is typically preferable, due to its simplicity and no loss of information, but needs more data. In Dynamics 365 Sales Insights, we are able take advantages of Bottom-Up for hierarchical forecasting, since we have access to rich data on past and current opportunities at the leaves levels of the hierarchy.