
There are three inter-related perspectives to consider when adopting a technology like Power BI.
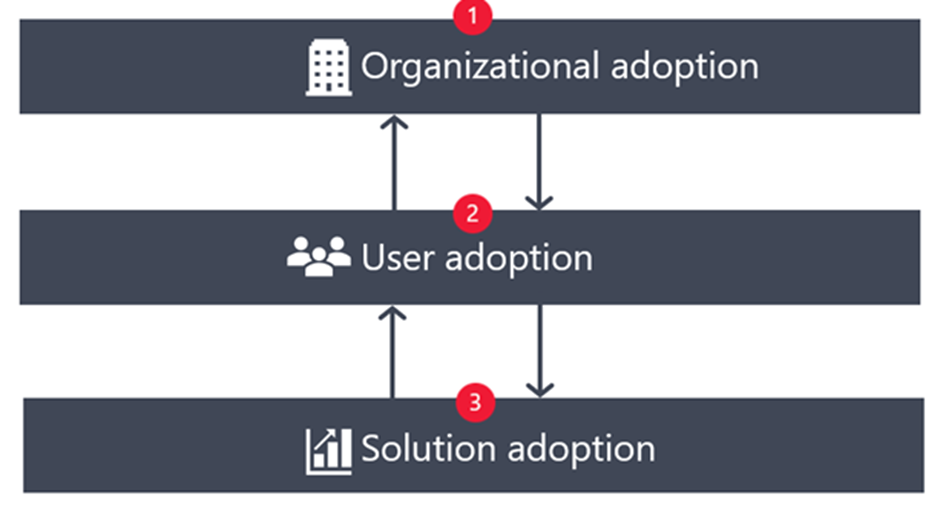
The three types of adoption shown in the above diagram include:
Organizational adoption: Organizational adoption refers to the effectiveness of Power BI governance. It also refers to data management practices that support and enable business intelligence efforts.
User adoption: User adoption is the extent to which consumers and creators continually increase their knowledge. It is concerned with whether they are actively using Power BI, and whether they are using it in the most effective way.
Solution adoption: Solution adoption refers to the impact and business value achieved for individual requirements and Power BI items.
As the four arrows in the previous diagram indicate, the three types of adoption are all strongly inter-related:
- Solution adoption affects user adoption. A well-designed and well-managed solution—which could be many things, such as a set of reports, an app, or a dataset—impacts and guides users on how to use Power BI in an optimal way.
- User adoption impacts organizational adoption. The patterns and practices used by individual users influence organizational adoption decisions, policies, and practices.
- Organizational adoption influences user adoption. Effective organizational practices—including mentoring, training, support, and community—encourage users to do the right thing in their day-to-day workflow.
- User adoption affects solution adoption. Stronger user adoption, because of the effective use of Power BI by educated and informed users, contributes to stronger and more successful individual solutions.
The remainder of this article introduces the three types of Power BI adoption in more detail.
Organizational adoption maturity levels
Organizational adoption measures the state of Power BI governance and data management practices. There are several organizational adoption goals:
- Effectively support the community.
- Enable and empower users.
- Oversee information delivery via enterprise BI and self-service BI with continuous improvement cycles.
It is helpful to think about organizational adoption from the perspective of a maturity model. For consistency with the Power CAT adoption maturity model and the maturity model for Microsoft 365, this Power BI adoption roadmap aligns with the five levels from the Capability Maturity Model, which were later enhanced by the Data Management Maturity (DMM) model from ISACA (note the DMM is a paid resource).
Every organization has limited time, funding, and people. So, it requires them to be selective about where they prioritize their efforts. To get the most from your investment in Power BI, seek to attain at least maturity level 300 or 400, as discussed below. It’s common that different business units in the organization evolve and mature at different rates, so be cognizant of the organizational state as well as progress for key business units.
Note:
Organizational adoption maturity is a long journey. It takes time, effort, and planning to progress to the higher levels.
Maturity level 100 – Initial
Level 100 is referred to as initial or performed. It is the starting point for new data-related investments that are new, undocumented, and without any process discipline.
Common characteristics of maturity level 100 include:
- Pockets of success and experimentation with Power BI exist in one or more areas of the organization.
- Achieving quick wins has been a priority, and it has delivered some successes.
- Organic growth has led to the lack of a coordinated strategy or governance approach.
- Practices are undocumented, with significant reliance on tribal knowledge.
- There are few formal processes in place for effective data management.
- Risk exists due to a lack of awareness of how data is used throughout the organization.
The potential for a strategic investment with Power BI is acknowledged, but there is no clear path forward for purposeful, organization-wide execution.
Maturity level 200 – Repeatable
Level 200 is referred to as repeatable or managed. At this point on the maturity curve, data management is planned and executed. Data management is based on defined processes, though these processes may not apply uniformly throughout the organization.
Common characteristics of maturity level 200 include:
- Certain Power BI content is now critical in importance and/or it is broadly used by the organization.
- There are attempts to document and define repeatable practices, however efforts are siloed, reactive, and deliver varying levels of success.
- There is an over-reliance on individuals having good judgment and adopting healthy habits that they learned on their own.
- Power BI adoptions continues to grow organically and produces value, however it takes place in an uncontrolled way.
- Resources for an internal community are established, such as a Teams channel or Yammer group.
- Initial planning for a consistent Power BI governance strategy is underway. There is recognition that a Power BI Center of Excellence (COE) can deliver value.
Maturity level 300 – Defined
Level 300 is referred to as defined. At this point on the maturity curve, a set of standardized data management processes are established and consistently applied across organizational boundaries.
Common characteristics of maturity level 300 include:
- Measurable success is achieved for the effective use of Power BI.
- Progress is made on the standardization of repeatable practices, though less-than-optimal aspects may still exist due to early uncontrolled growth.
- The Power BI COE is established, and it has clear goals and scopes of responsibilities.
- The internal community gains traction with the participation of a growing number of users.
- Power BI champions emerge in the community.
- Initial investments in training, documentation, and resources are made.
- An initial governance model is in place.
- Power BI has an active and engaged executive sponsor.
- Roles and responsibilities for all Power BI stakeholders are well understood.
Maturity level 400 – Capable
Level 400 is known as capable or measured. At this point on the maturity curve, data is well-managed across its entire lifecycle.
Common characteristics of maturity level 400 include:
- Business intelligence efforts deliver significant value.
- Power BI is commonly used for delivering critical content throughout the organization.
- There is an established and accepted governance model with cooperation from all key business units.
- Training, documentation, and resources are readily available for, and actively used by, the Power BI community of users.
- Standardized processes are in place for the oversight and monitoring of Power BI usage and practices.
- The Power BI COE includes representation from all key business units.
- A Power BI champions network supports the internal community: champions actively work with their colleagues and the COE.
Maturity level 500 – Efficient
Level 500 is known as efficient or optimizing because at this point on the maturity curve, the emphasis is now on automation and continuous improvement.
Common characteristics of maturity level 500 include:
- The value of Power BI solutions is prevalent in the organization, and Power BI is widely accepted throughout the organization.
- Power BI skillsets are highly valued in the organization, and they are recognized by leadership.
- The internal Power BI community is self-sustaining, with support from the COE. The community is not over-reliant on key individuals.
- The COE reviews key performance indicators regularly to measure success of implementation and adoption goals.
- Continuous improvement is a continual priority.
- Use of automation adds value, improves productivity, or reduces risk for error.
Note:
The above characteristics are generalized. When considering maturity levels and designing a plan, you’ll want to consider each topic or goal independently. In reality, it’s probably not possible to reach level 500 maturity level for every aspect of Power BI adoption for the entire organization. So, assess maturity levels independently per goal. That way, you can prioritize your efforts where they will deliver the most value. The remainder of the articles in this Power BI adoption series present maturity levels on a per-topic basis.
Individuals—and the organization itself—continually learn, change, and improve. So, that means there’s no formal end to adoption-related efforts. However, it is common that effort is reduced as higher maturity levels are reached.
The remainder of this article introduces the second and third types of adoption: user adoption and solution adoption.
Note:
The remaining articles in this series focus primarily on organizational adoption.
User adoption stages
User adoption measures the extent to which content consumers and self-service content creators are actively using Power BI effectively. Usage statistics alone do not indicate user adoption. User adoption is also concerned with individual user behaviors and practices. The aim is to ensure users engage with Power BI in the correct way and to its fullest extent.
User adoption encompasses how consumers view content, as well as how self-service creators generate content for others to consume.
User adoption occurs on an individual user basis, but it’s measured and analyzed in the aggregate. Individual users progress through the four stages of user adoption at their own pace. An individual who adopts a new technology will take some time to achieve proficiency. Some users will be eager; others will be reluctant to learn yet another tool, regardless of the promised productivity improvements. Advancing through the user adoption stages involves time and effort, and it involves behavioral changes to become aligned with organizational adoption objectives. The extent to which the organization supports users advancing through the user adoption stages has a direct correlation to the organizational-level adoption maturity.
User adoption stage 1 – Awareness
Common characteristics of stage 1 user adoption include:
- An individual has heard of, or been initially exposed to, Power BI in some way.
- An individual may have access to Power BI but is not yet actively using it.
User adoption stage 2 – Understanding
Common characteristics of stage 2 user adoption include:
- An individual develops understanding of the benefits of Power BI to deliver analytical value and support decision-making.
- An individual shows interest and starts to use Power BI.
User adoption stage 3 – Momentum
Common characteristics of stage 3 user adoption include:
- An individual actively gains Power BI skills by attending formal training, self-directed learning, or experimentation.
- An individual gains basic competency with the aspects of Power BI relevant to their role.
User adoption stage 4 – Proficiency
Common characteristics of stage 4 user adoption include:
- An individual actively uses Power BI on a regular basis.
- An individual understands how to use Power BI in the way in which it was intended, as relevant for their role.
- An individual modifies their behavior and activities to align with organizational governance processes.
- An individual’s willingness to support organizational processes and change efforts is growing over time, and they become an advocate for Power BI in the organization.
- An individual makes the effort to continually improve their skills and stay current with new product capabilities and features.
It’s easy to underestimate the effort it takes to progress from stage 2 (understanding) to stage 4 (proficiency). Typically, it takes the longest time to progress from stage 3 (momentum) to stage 4 (proficiency).
Solution adoption phases
Solution adoption is concerned with measuring the impact of individual Power BI solutions. It is also concerned with the level of value solutions provide. The scope for evaluating solution adoption is for one set of requirements, like a set of reports or a single Power BI app.
As a solution progresses to phases 3 or 4, expectations to operationalize the solution are higher.
Solution phase 1 – Exploration
Common characteristics of phase 1 solution adoption include:
- Exploration and experimentation are the main approaches to testing out new ideas. Exploration of new ideas can occur through informal self-service BI, or through a formal proof of concept (POC), which is purposely narrow in scope. The goal is to confirm requirements, validate assumptions, address unknowns, and mitigate risks.
- A small group of users test the proof of concept solution and provide useful feedback.
- All exploration—and initial feedback—could occur within Power BI Desktop or Excel. Use of the Power BI service is limited.
Solution phase 2 – Functional
Common characteristics of phase 2 solution adoption include:
- The solution is functional and meets the basic set of user requirements. There are likely plans to iterate on improvements and enhancements.
- The solution is deployed to the Power BI service.
- All necessary supporting components are in place, such as gateways to support scheduled refresh.
- Users are aware of the solution and show interest in using it. Potentially, it may be a limited preview release, and may not yet be ready to promote to a production workspace.
Solution phase 3 – Valuable
Common characteristics of phase 3 solution adoption include:
- Target users find the solution is valuable and experience tangible benefits.
- The solution is promoted to a production workspace.
- Validations and testing occur to ensure data quality, accurate presentation, accessibility, and acceptable performance.
- Content is endorsed, when appropriate.
- Usage metrics for the solution are actively monitored.
- User feedback loops are in place to facilitate suggestions and improvements that can contribute to future releases.
- Solution documentation is generated to support the needs of information consumers (such as data sources used or how metrics are calculated), and help future creators (such as documenting any future maintenance or planned enhancements).
- Ownership and subject matter experts for the content is clear.
- Report branding and theming are in place, and they are inline with governance guidelines.
Solution phase 4 – Essential
Common characteristics of phase 4 solution adoption include:
- Target users actively and routinely use the solution, and it’s considered essential for decision-making purposes.
- The solution resides in a production workspace well-separated from development and test content. Change management and release management is carefully controlled due to the impact of changes.
- A subset of users regularly provide feedback to ensure the solution continues to meet requirements.
- Expectations for the success of the solution are clear and are measured.
- Expectations for support of the solution are clear, especially if there are service level agreements.
- The solution aligns with organizational governance guidelines and practices.
- Most content is certified since it’s critical in nature.
- Formal user acceptance testing for new changes may occur, particularly for IT-managed content.
Learn More:
CVT’s technology solutions enable effective solutions and speedy digital transformation by utilizing cutting-edge information technologies to Power BI, as well as our in-depth knowledge of markets and technological innovation. As a result, we have become an invaluable business partner.
For expert advice on Power BI contact us at contact@codevalue.in and follow us @codevaluetechnologies.