
Employees may make quicker judgments and perform more efficiently when they use automated technology, greater research, and analysis.
On the other hand, it appears to be a difficult and expensive task to replace the current system. Companies that want to modernise their business processes and improve productivity, security, and mobility must rely less on the IT department.
Organizations can easily create crucial line-of-business apps in a low-code environment with Dynamics 365 and model-driven Power Apps, enhancing agility and modernising processes. These apps are supported by your primary business data because they were all developed on Dataverse. Information workers may now access this data and study it using Power BI’s robust data analytics capabilities without ever leaving their app thanks to this connection right on views. Simply select the “Visualize this view” button to have Power BI generate a report overlaying the precise data you were viewing.
There are lots of new features as well. Read on to learn about all the recent improvements.
1. Saving reports to the Power BI service
You can now save the reports you create through this integration back to the Power BI service. Once you save this report, it becomes a normal Power BI report. You can share it, package it in an app, subscribe to email updates, or even download the .pbix to make further modifications.
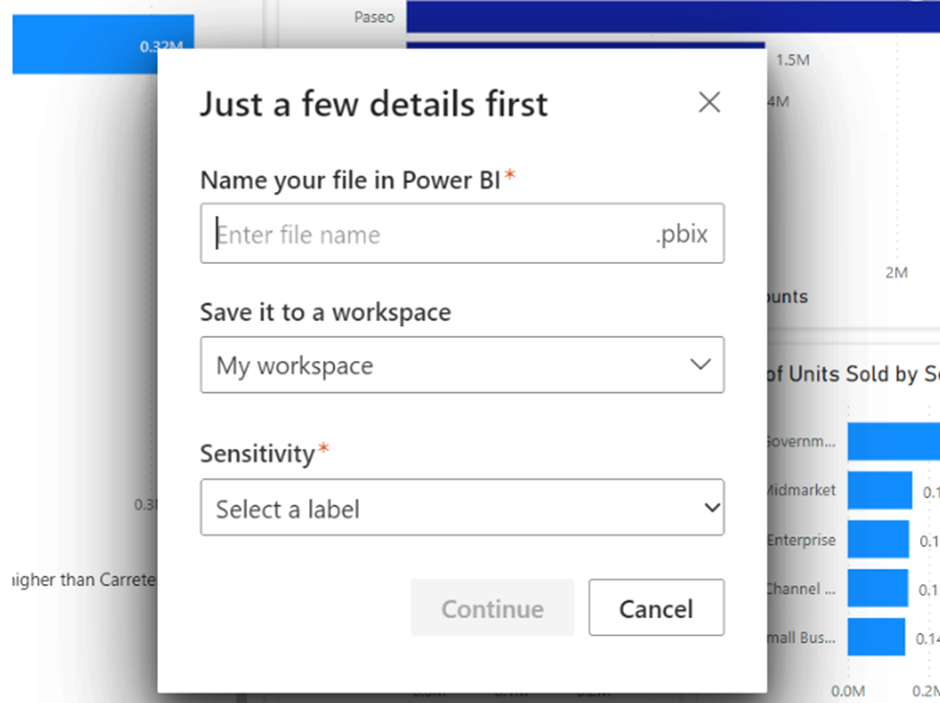
When you’re ready to save your work after finishing your research, simply click the save button in the app bar, name it, choose a workspace, and, if your organisation allows it, add a sensitivity label. Any workspace where you have the Contributor, Member, or Admin role assigned will allow you to save. You can save to your private workspace as a free user.
Once you saved the report, we’ll give you a link to access it in the Power BI service. Clicking the link will open it for you in a new tab.
Once you saved the report, we’ll give you a link to access it in the Power BI service. Clicking the link will open it for you in a new tab.

The dataset that gets saved through this flow is automatically configured as DirectQuery with SSO enabled. This means that it will always be up to date and respect Dataverse security settings. Of course, once you’ve saved the report and dataset, you’ll be able to go into the dataset’s settings and change it later.
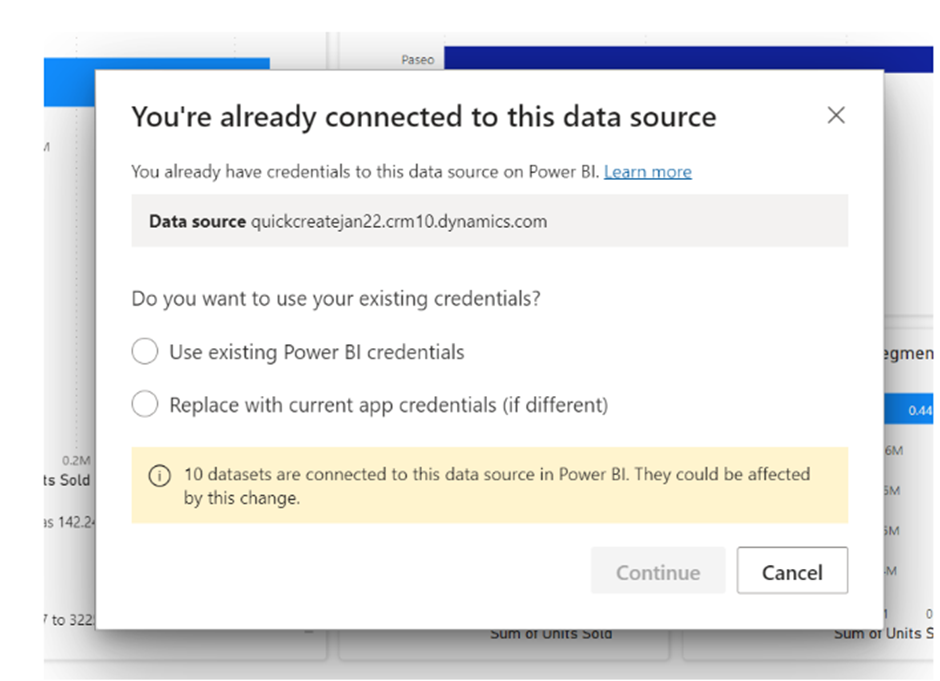
If you already have credentials in Power BI configured for the specific Dataverse environment you’re connecting to, and it isn’t set to SSO, we won’t automatically override this. Instead, we’ll ask you to decide how you want to handle your credentials. You can choose to either keep what’s already stored in Power BI or override it to use SSO. If you decide to keep what’s already in Power BI, your report may show different data once you view it in the Power BI service. If you decide to override, this will also update your existing datasets connected to the same source.
Once the report is in the Power BI service, that is where you’ll access it going forward. However, if you’d like make it a standardized report included in your app, you can always choose to embed it back into the app.
2. Display names
This is another another popular request during preview. Now whenever you visualize, the names of the fields in the Your Data pane will match the same column names you see in the view.
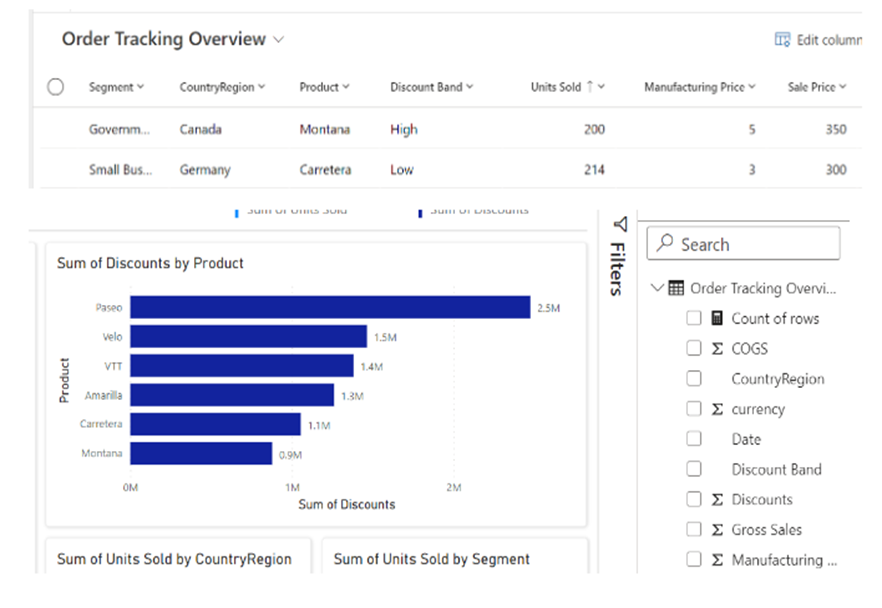
The field names will match exactly what you see in the view, which means if you’re seeing localized names based on the language, you’re viewing the app in, the names in the Power BI report will also be localized.
performance optimizations that significantly improve the load time for the longest running reports. We’ve also removed some of the extra system columns that showed up in the Your Data pane, so the list of fields is easier to read through. There are a few system columns still remaining, but we’ll continue to improve this experience in future updates.
3. Quality of life improvements
performance optimizations that significantly improve the load time for the longest running reports. We’ve also removed some of the extra system columns that showed up in the Your Data pane, so the list of fields is easier to read through. There are a few system columns still remaining, but we’ll continue to improve this experience in future updates.
4. Get started now
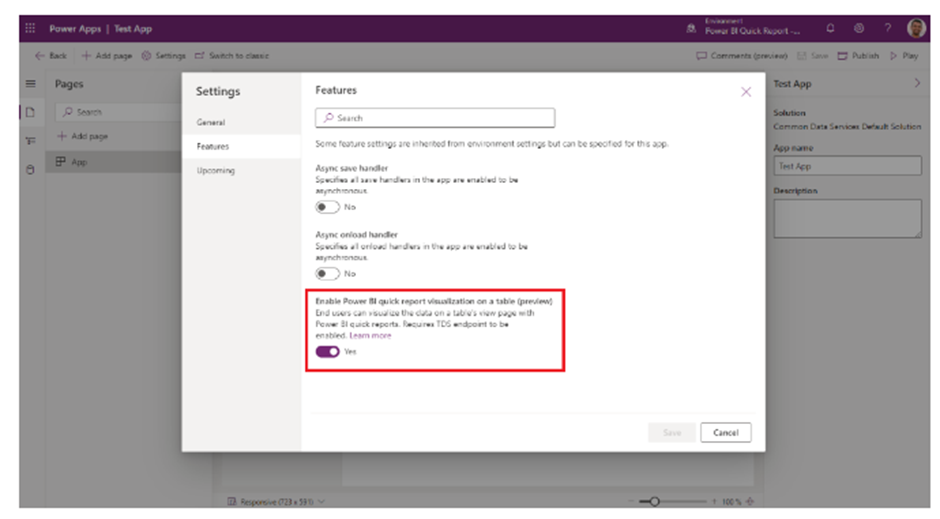
It’s a great time to try out this integration, and if you’re an app creator, enable it for your end users. You can add it to any app through the app settings.
Learn more:
With the help of Microsoft Dynamics 365 and Power BI, you can thoroughly analyse your data and make wise plans while being productive and innovative.
CVT’s technology solutions enable effective solutions and speedy digital transformation by utilizing cutting-edge information technologies to Dynamics 365 and Power BI, as well as our in-depth knowledge of markets and technological innovation. As a result, we have become an invaluable business partner.
For our expert consultants advice on Power BI please contact us at contact@codevalue.in and follow us @codevaluetechnologies.