
A Power BI dashboard is a single page, often called a canvas, that uses visualizations to tell a story. Because it is limited to one page, a well-designed dashboard contains only the most-important elements of that story.
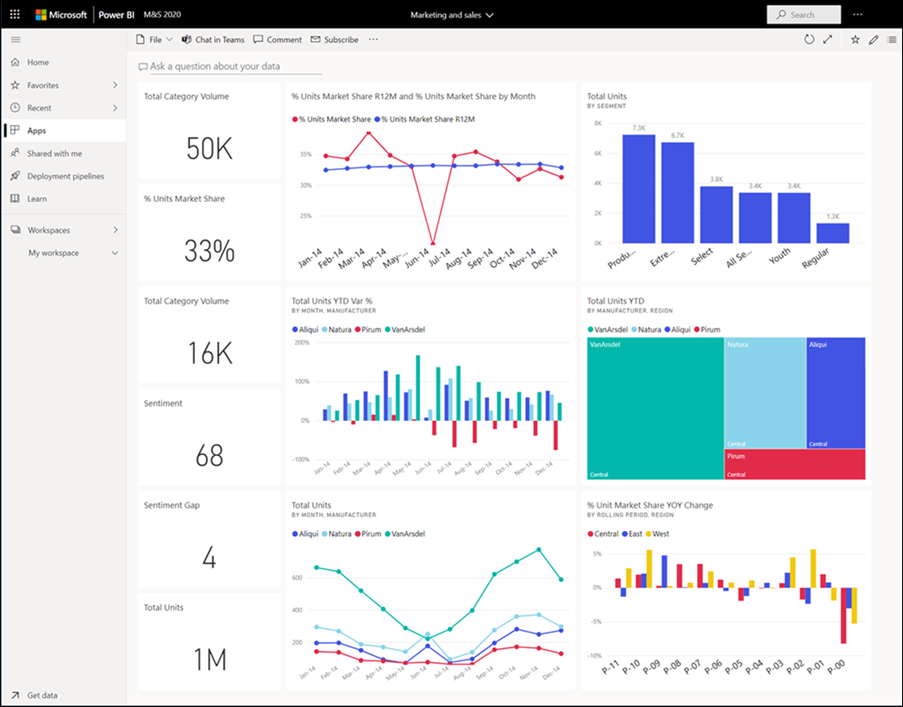
The visualizations you see on the dashboard are called tiles and are pinned to the dashboard by report designers. In most cases, selecting a tile takes you to the report page where the visualization was created. If you’re new to Power BI, you can get a good foundation by reading Power BI basic concepts.
Note
Dashboards can be Viewed and shared on mobile devices.
For colleagues to be able to share dashboards with you, your version of Power BI must be “Pro” or “Premium.” For more information, see Power BI License types.
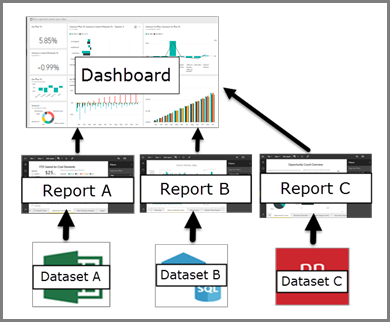
The visualizations on a dashboard come from reports and each report is based on one dataset. In fact, one way to think of a dashboard is as an entryway into the underlying reports and datasets. Selecting a visualization takes you to the report that was used to create it.
Advantages of dashboards
Dashboards are a wonderful way to monitor your business, to look for answers, and to see all of your most-important metrics at a glance. The visualizations on a dashboard may come from one underlying dataset or many, and from one underlying report or many. A dashboard can combine on-premises and cloud data, providing a consolidated view regardless of where the data lives.
A dashboard isn’t just a pretty picture; it’s interactive and the tiles update as the underlying data changes.
Dashboards versus reports for Power BI business users
Reports are often confused with dashboards since they too are canvases filled with visualizations. But there are some major differences from a Power BI business user point of view.
Dashboard designers and dashboard business users
| DASHBOARDS VERSUS REPORTS FOR POWER BI BUSINESS USERS | ||
| Capability | Dashboards | Reports |
| Pages | One page | One or more pages |
| Ask a question about your data (Power BI Q&A) field at top | almost always | no |
| Data sources | One or more reports and one or more datasets per dashboard | A single dataset per report |
| Filtering | Can’t filter or slice | Many different ways to filter, highlight, and slice |
| Set alerts | Can create alerts to email you when certain conditions are met | No |
| Featured | Can set one dashboard as your “featured” dashboard | Cannot create a featured report |
| Can see underlying dataset tables and fields | No. Can export data but can’t see tables and fields in the dashboard itself. | Yes. Can see dataset tables and fields and values. |
As a Power BI business user, you receive dashboards from designers. Continue learning about dashboards with these topics:
- View a dashboard
- Learn about dashboard tiles and what will happen when you select one.
- Want to track an individual dashboard tile and receive an email when it reaches a certain threshold? Create alerts on tiles.
- Have fun asking your dashboard questions. Learn how to use Power BI Q&A to ask a question about your data and get the answer in the form of a visualization.