
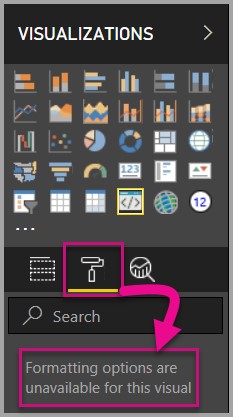
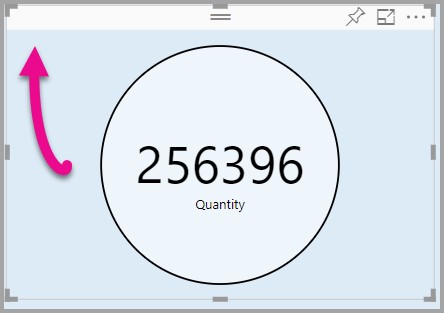
- In Power BI, select the Format page.
You should see a message that reads – Formatting options are unavailable for this visual.
- In Visual Studio Code, open the capabilities.json file.
- Before the dataViewMappings array, add objects (after line 8).
JSONCopy
“objects”: {},
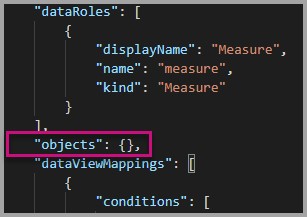
- Save the capabilities.json file.
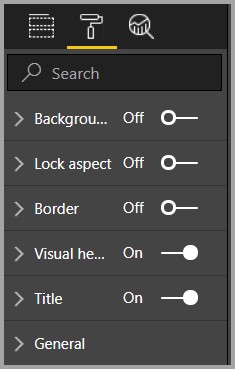
- In Power BI, review the formatting options again.
Note
If you do not see the formatting options change then select Reload Custom Visual.
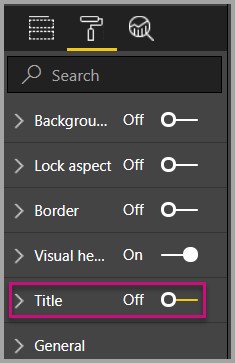
- Set the Title option to Off. Notice that the visual no longer displays the measure name at the top-left corner.
Adding custom formatting options
You can add custom properties to enable configuring the color of the circle, and also the border width.
- In PowerShell, stop the custom visual.
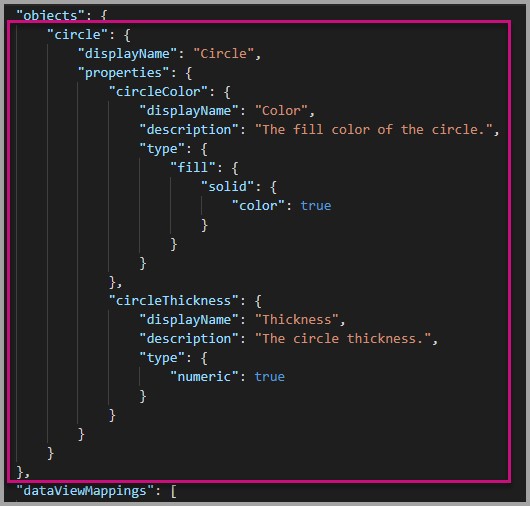
- In Visual Studio Code, in the capabilities.json file, insert the following JSON fragment into the object labeled objects.
JSONCopy
{
“circle”: {
“displayName”: “Circle”,
“properties”: {
“circleColor”: {
“displayName”: “Color”,
“description”: “The fill color of the circle.”,
“type”: {
“fill”: {
“solid”: {
“color”: true
}
}
}
},
“circleThickness”: {
“displayName”: “Thickness”,
“description”: “The circle thickness.”,
“type”: {
“numeric”: true
}
}
}
}
}
The JSON fragment describes a group named circle, which consists of two options named circleColor and circleThickness.
- Save the capabilities.json file.
- In the Explorer pane, from inside the src folder, and then select settings.ts. This file represents the settings for the starter visual.
- In the settings.ts file, replace the two classes with the following code.
TypeScriptCopy
export class CircleSettings {
public circleColor: string = “white”;
public circleThickness: number = 2;
}
export class VisualSettings extends DataViewObjectsParser {
public circle: CircleSettings = new CircleSettings();
}
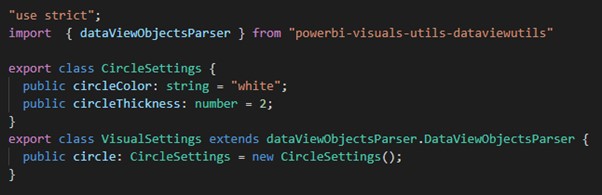
This module defines the two classes. The CircleSettings class defines two properties with names that match the objects defined in the capabilities.json file (circleColor and circleThickness) and also sets default values. The VisualSettings class inherits the DataViewObjectParser class and adds a property named circle, which matches the object defined in the capabilities.json file, and returns an instance of CircleSettings.
- Save the settings.ts file.
- Open the visual.ts file.
- In the visual.ts file,
import VisualSettings, VisualObjectInstanceEnumeration and EnumerateVisualObjectInstancesOptions:
TypeScriptCopy
import { VisualSettings } from “./settings”;
import VisualObjectInstanceEnumeration = powerbi.VisualObjectInstanceEnumeration;
import EnumerateVisualObjectInstancesOptions = powerbi.EnumerateVisualObjectInstancesOptions;
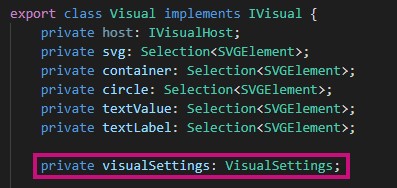
and in the Visual class add the following property:
TypeScriptCopy
private visualSettings: VisualSettings;
This property stores a reference to the VisualSettings object, describing the visual settings.
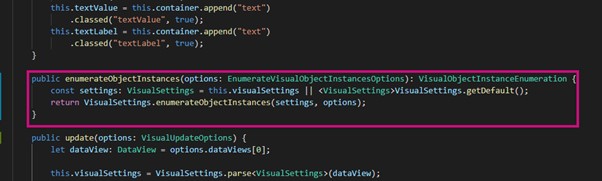
- In the Visual class, add the following method before the update method. This method is used to populate the formatting options.
TypeScriptCopy
public enumerateObjectInstances(options: EnumerateVisualObjectInstancesOptions): VisualObjectInstanceEnumeration {
const settings: VisualSettings = this.visualSettings || <VisualSettings>VisualSettings.getDefault();
return VisualSettings.enumerateObjectInstances(settings, options);
}
This method is used to populate the formatting options.
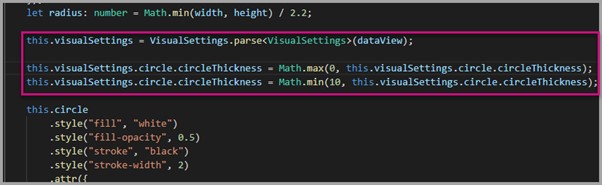
- In the update method, after the declaration of the radius variable, add the following code.
TypeScriptCopy
this.visualSettings = VisualSettings.parse<VisualSettings>(dataView);
this.visualSettings.circle.circleThickness = Math.max(0, this.visualSettings.circle.circleThickness);
this.visualSettings.circle.circleThickness = Math.min(10, this.visualSettings.circle.circleThickness);
This code retrieves the format options. It adjusts any value passed into the circleThickness property, converting it to 0 if negative, or 10 if it’s a value greater than 10.
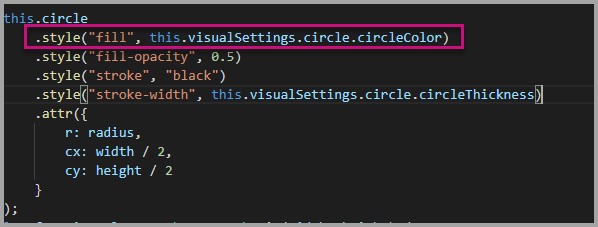
- For the circle element, modify the value passed to the fill style to the following expression.
TypeScriptCopy
this.visualSettings.circle.circleColor
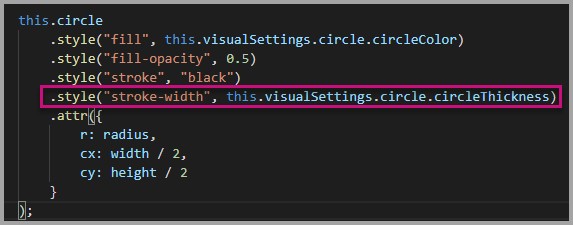
- For the circle element, modify the value passed to the stroke-width style to the following expression.
TypeScriptCopy
this.visualSettings.circle.circleThickness
- Save the visual.ts file.
- In PowerShell, start the visual.
PowerShellCopy
pbiviz start
- In Power BI, in the toolbar floating above the visual, select Toggle Auto Reload.
- In the visual format options, expand Circle.
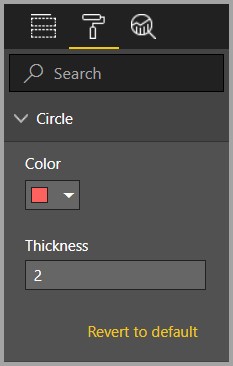
Modify the color and thickness option.
Modify the thickness option to a value less than zero, and a value higher than 10. Then notice the visual updates the value to a tolerable minimum or maximum.
Packaging the custom visual
Enter property values for the custom visual project, update the icon file, and then package the custom visual.
- In PowerShell, stop the custom visual.
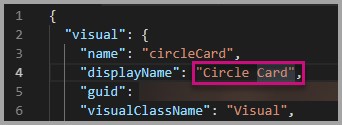
- Open the pbiviz.json file in Visual Studio Code.
- In the visual object, modify the displayName property to Circle Card.
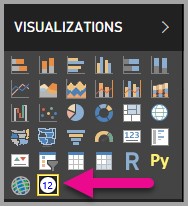
In the Visualizations pane, hovering over the icon reveals the display name.
- For the description property, enter the following text.
Displays a formatted measure value inside a circle
- Fill supportUrl and gitHubUrl for the visual.
Example:
JSONCopy
{
“supportUrl”: “https://community.powerbi.com”,
“gitHubUrl”: “https://github.com/microsoft/PowerBI-visuals-circlecard”
}
- Enter your details in the author object.
- Save the pbiviz.json file.
- In the assets object, notice that the document defines a path to an icon. The icon is the image that appears in the Visualizations pane. It must be a PNG file, 20 pixels by 20 pixels.
- In Windows Explorer, copy the icon.png file, and then paste it to replace the default file located at assets folder.
- In Visual Studio Code, in the Explorer pane, expand the assets folder, and then select the icon.png file.
- Review the icon.

- In Visual Studio Code, ensure that all files are saved.
- To package the custom visual, in PowerShell, enter the following command.
PowerShellCopy
pbiviz package
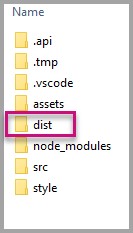
Now the package is output to the dist folder of the project. The package contains everything required to import the custom visual into either the Power BI service or a Power BI Desktop report. You have now packaged the custom visual, and it is now ready for use.
Importing the custom visual
Now you can open the Power BI Desktop report, and import the Circle Card custom visual.
- Open Power BI Desktop, create a new report with any sample dataset
- In the Visualizations pane, select the ellipsis, and then select Import from File.
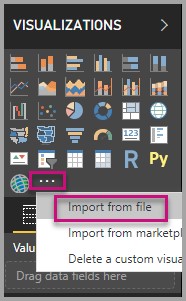
- In the import window, select Import.
- In the Open window, navigate to the dist folder in your project directory.
- Select the circleCard.pbiviz file, and then select Open.
- When the visual has successfully imported, select OK.
- Verify that the visual has been added to the Visualizations pane.
- Hover over the Circle Card icon, and notice the tooltip that appears.